
Continuous Flow Diffusion Chambers: INKA and mINKA

INKA (Ice Nucleation instrument of the Karlsruhe Institute of Technology, Schiebel, 2017) and its mobile version mINKA are two Continuous Flow Diffusion Chambers. These two instruments allow us to investigate the ice nucleating ability of aerosol particles at different temperatures and saturation ratios.
Working Principle
INKA and mINKA base their design on the flow tube developed by Rogers (1988). Here, two cylinders of different diameters form an annular gap of ≈1cm width. The cylinders are approximately 150cm and 85cm long, for INKA and mINKA respectively. The cylinders wall are temperature-controlled and, during measurements, coated with a thin layer of ice.
By assessing a temperature difference between the walls, temperature, and water vapor gradients establish inside the annular gap, generating ice supersaturated conditions between the walls (shown in the video in the lower Exemplary Experiment section).
At the outlet of the diffusion chamber, an optical particle counter detects larger aerosol particles, droplets, and ice crystals. The ice crystals are distinguished thanks to their larger optical diameter.
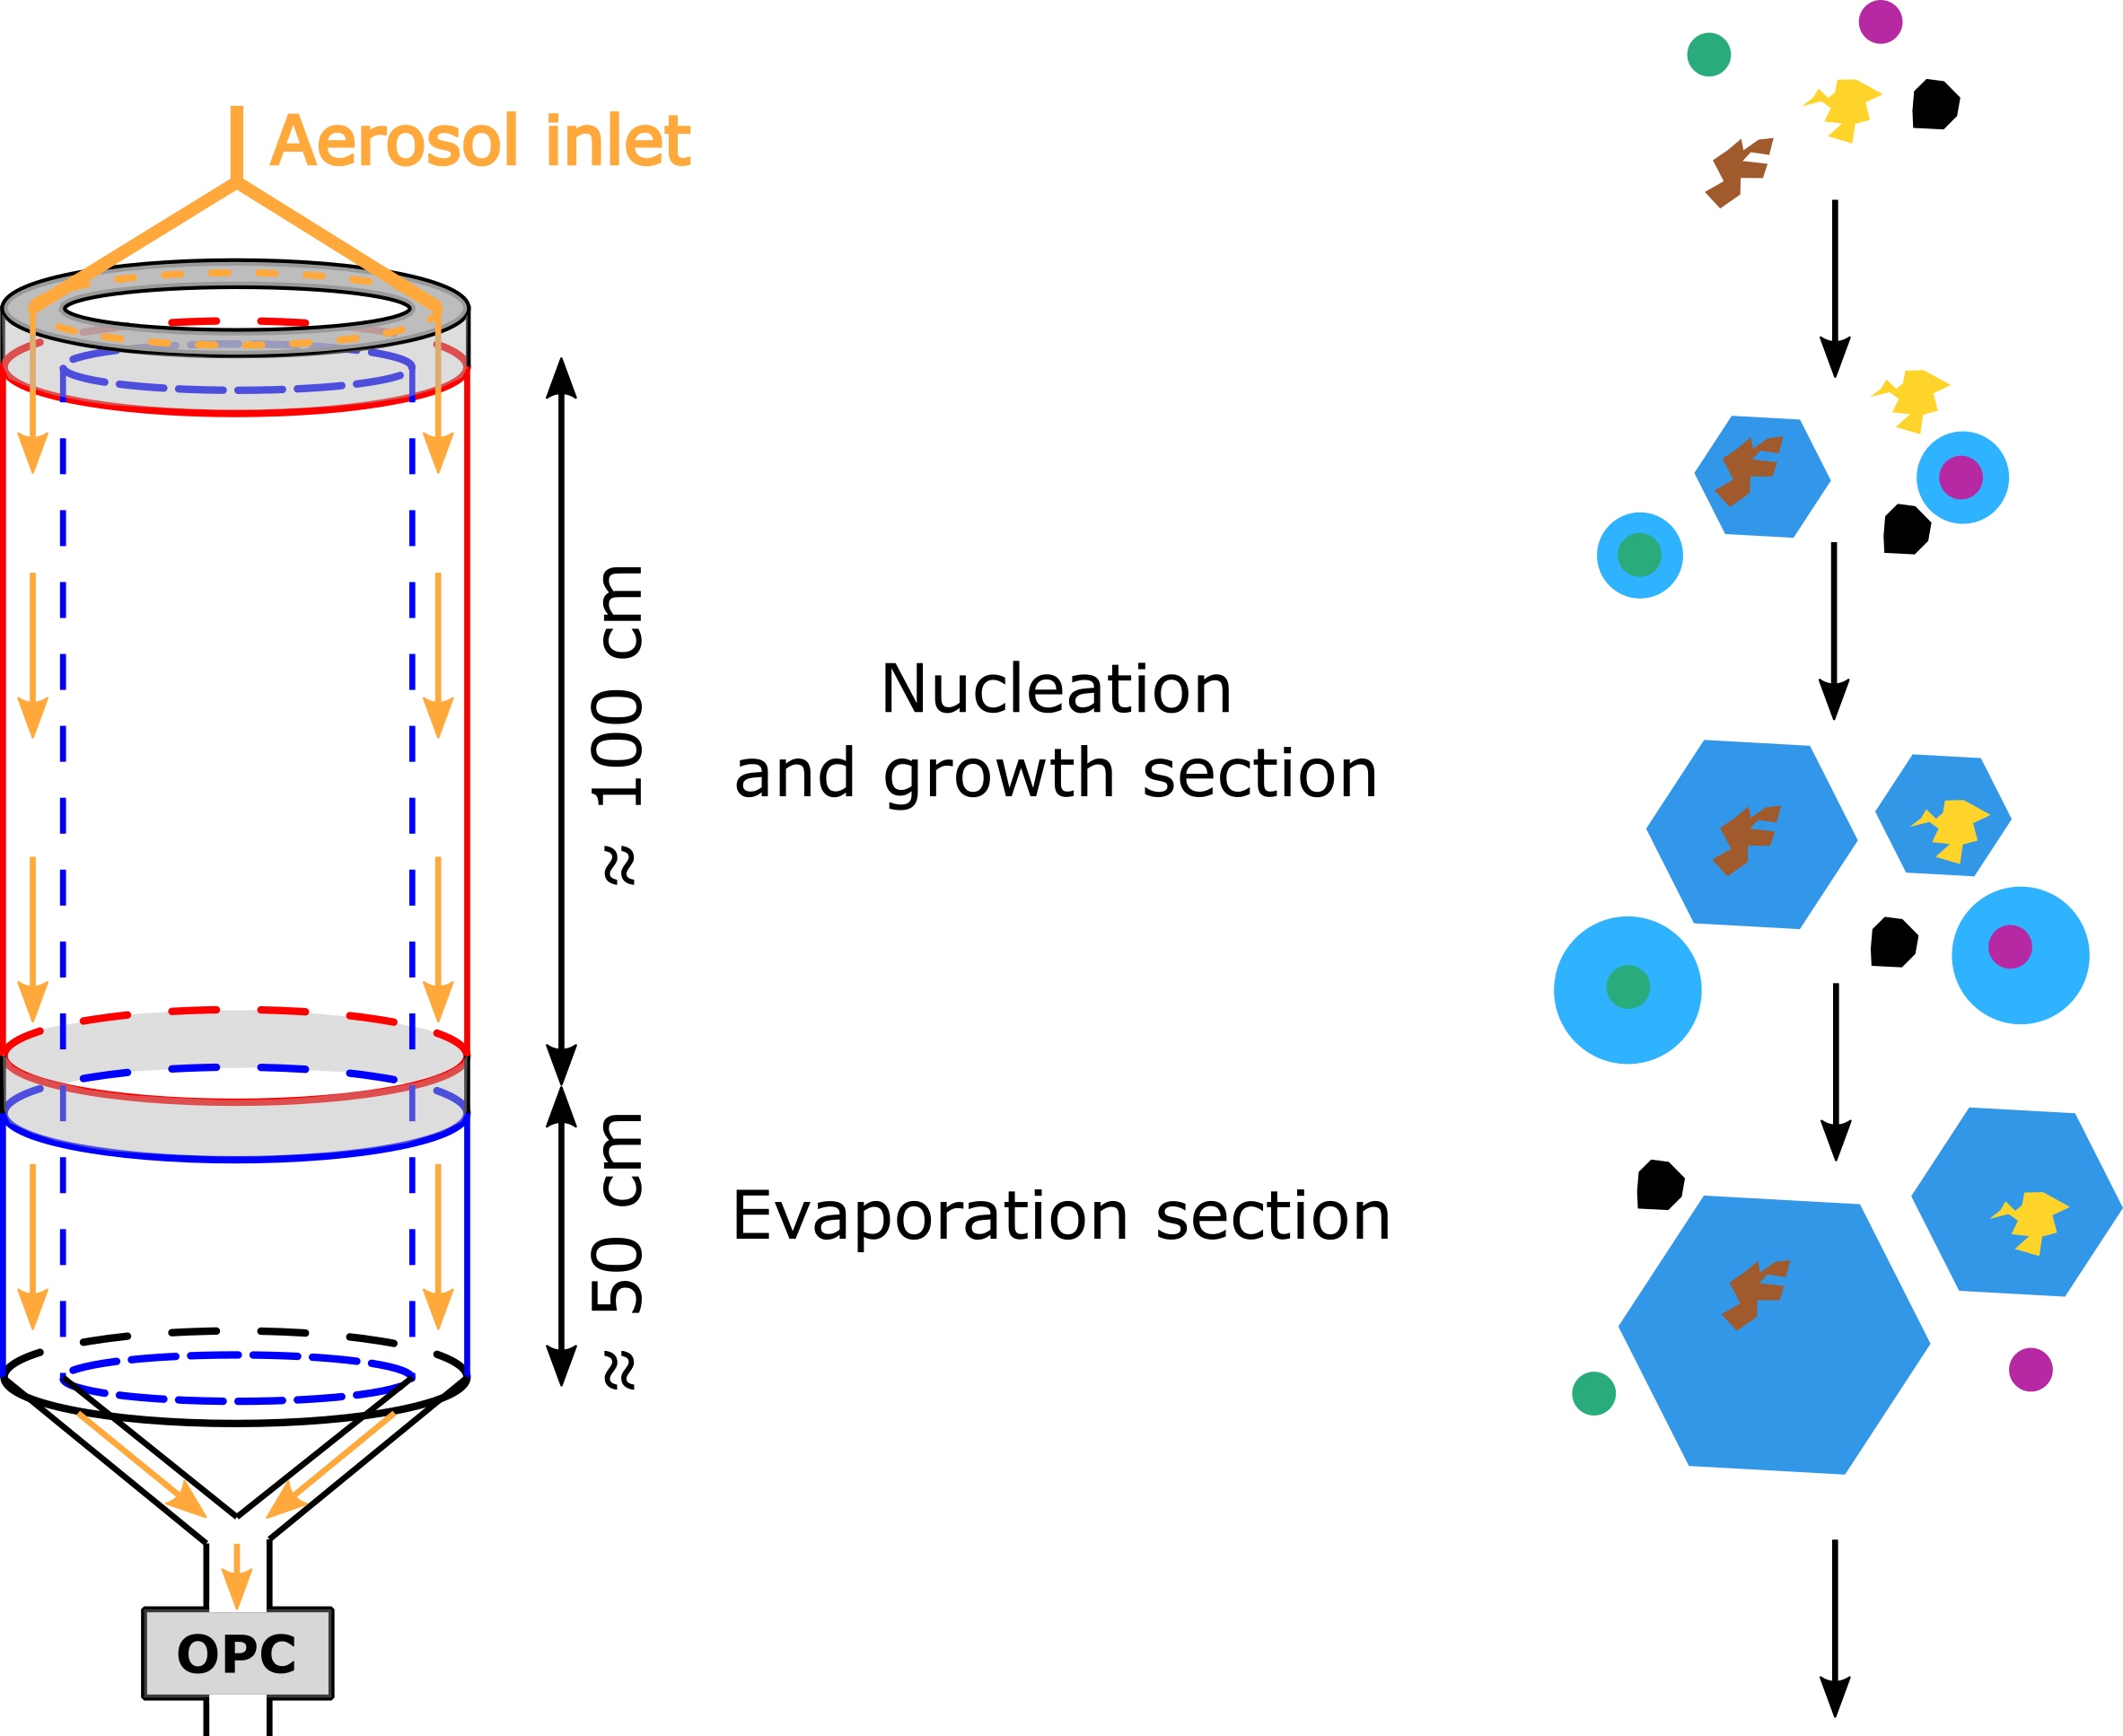
To facilitate the distinction between droplets and ice crystals, the lower part of the diffusion tube can be operated as an evaporation section (see INKA’s schematic in the left, upper figure). The inner and outer walls in the lower third of both cylinders can be kept at the same temperature. In this case, the relative humidity in this section drops to ice-saturated conditions and sub-saturated conditions with respect to liquid water. However, when experiments are performed at a temperature lower than -38°C, the lower part of the instruments can also be operated at supersaturated conditions to maximize the residence time of the aerosol particles at favorable conditions for ice nucleation and growth (see mINKA’s schematic in the left, lower figure).
To expose the aerosol particles to uniform temperature and saturation conditions, the sample flow only represents a small fraction of the total flow (5-10 %) and is encased in a particle-free dry synthetic airflow.
A home-build LabView software controls wall temperature and mass flow rates. Ice nucleation experiments can thus be performed either (i) at constant temperature by increasing the saturation, (ii) at constant saturation by decreasing the sample temperature, or (iii) at fixed temperature and saturation.
Schematic of the INKA chamber when operated with an evaporation section. The walls in the upper part of the instrument are kept at different subzero temperatures to create ice supersaturated conditions to eventually allow ice nucleation and ice crystals growth. In the evaporation section instead, the walls are kept at the same temperature to reduce the water saturation ratio and evaporate liquid water droplets.
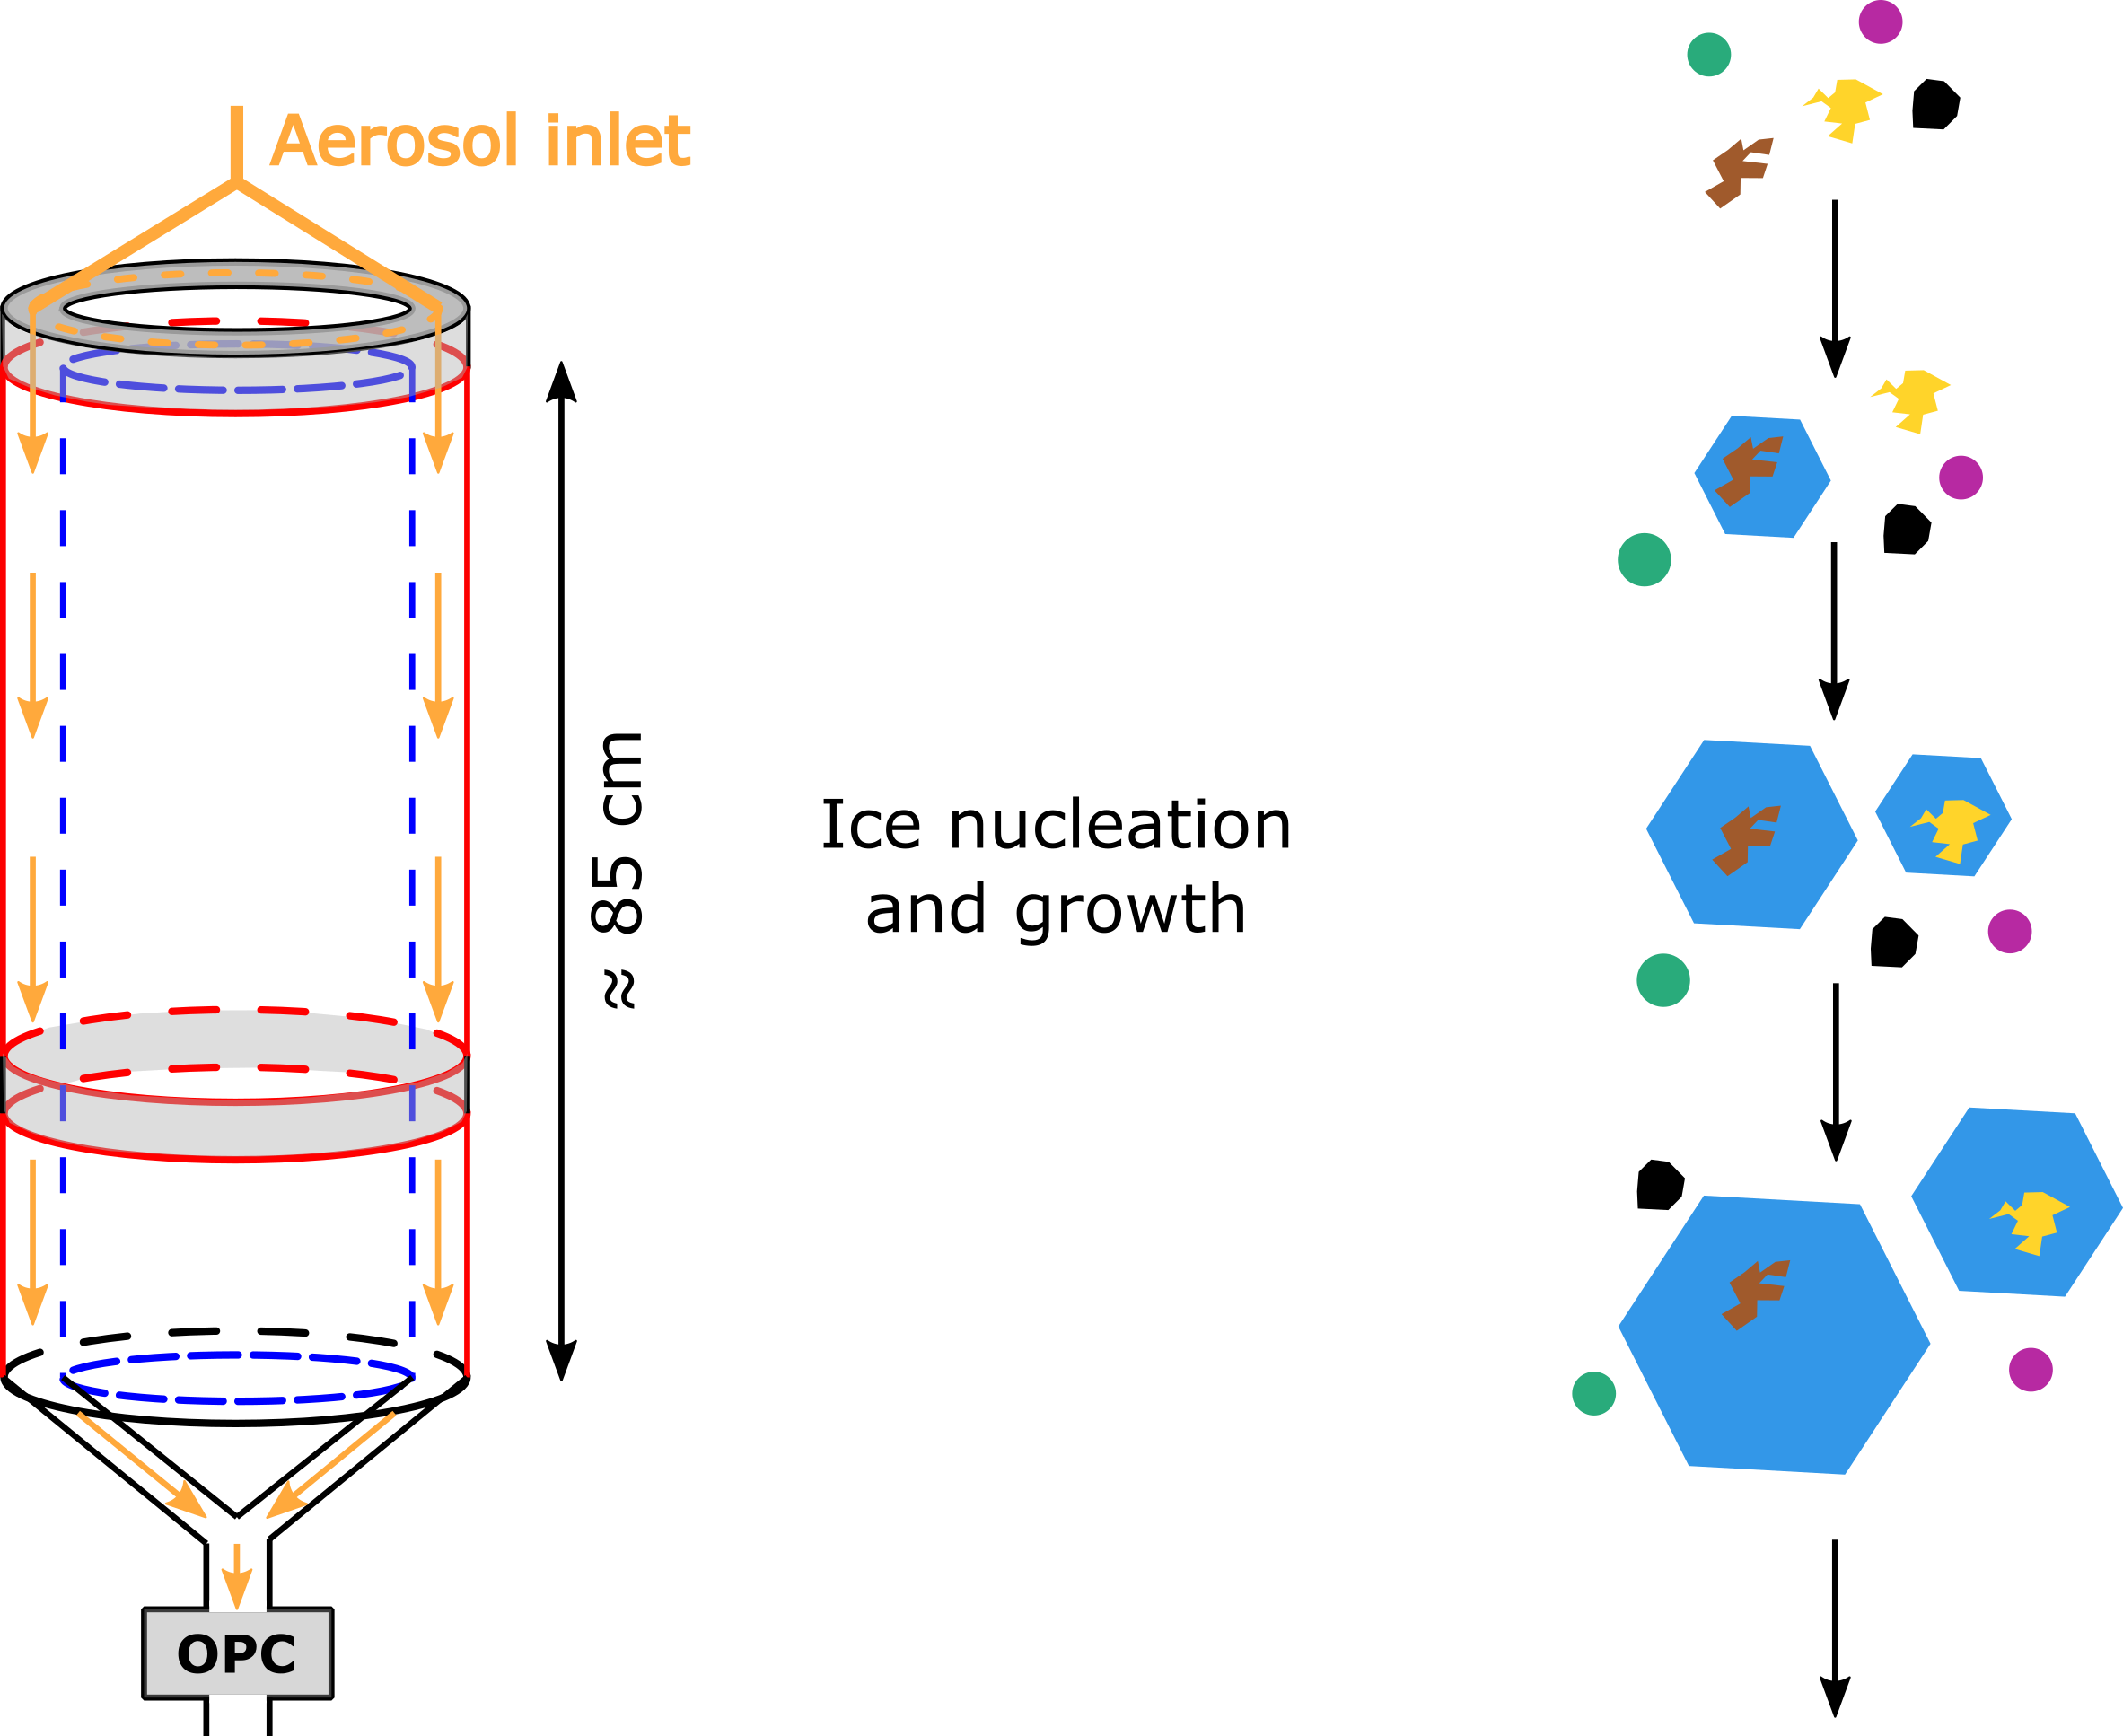
Schematic of the mINKA chamber when operated in the ice nucleation and growth mode for the whole length of the instrument. This configuration allows maximizing the time the aerosol particles are exposed to ice supersaturated conditions, facilitating the ice crystals' growth to sizes detectable by the optical particle counter (OPC).
Exemplary Experiment
An exemplary saturation scan performed with INKA at the nominal temperature of -20°C is shown. In the left plots, the experiment time series is shown, in the right plots instead, profiles of different variables in the annular gap are reported.
Panel a: evolution of the outer (warm) and inner (cold) wall temperature are shown in red and blue, respectively. The constant temperature experienced by the aerosol particles is shown in orange.
Panel b: Time series of the saturation ratio with respect to liquid water (left axis) and ice (right axis) at the aerosol position inside the annular gap.
Panel c: single-particle data from the optical particle counter are reported on the left axis, each black dot corresponds to an aerosol particle (lower section of the plot) or ice crystal (upper part of the plot). The number concentration of ice nucleating particles is reported on the right axis (red).
Panel d: temperature and water vapor pressure gradients between the instrument’s walls. The cold and warm walls are located in correspondence with the left axis and right axis, respectively. The position of the aerosol flow (5%in the experiment here reported) is indicated with a gray shaded area.
Panel e and f: Ice and liquid water saturation ratio profiles that establish in the annular gap.
Panel g: velocity profile for a total flow of 12.5 L min-1.