
Freezing Assay INSEKT

Working Principle
The Ice Nucleation Spectrometer of the Karlsruhe Institute of Technology (INSEKT) is a freezing assay, which we use to quantify the content of ice-nucleating particles (INPs) in aerosol particle samples in the immersion freezing mode. Immersion freezing processes are relevant for the formation and evolution of mixed-phase clouds in the atmosphere.
The general working principle of freezing assays is that multiple pico- to microliter scale volumes of water suspended aerosol samples are supported on a substrate, which is cooled down with a constant rate until the volumes are frozen. INP concentrations as a function of freezing temperature are calculated by detecting the fraction of frozen aliquots in dependence of the temperature.
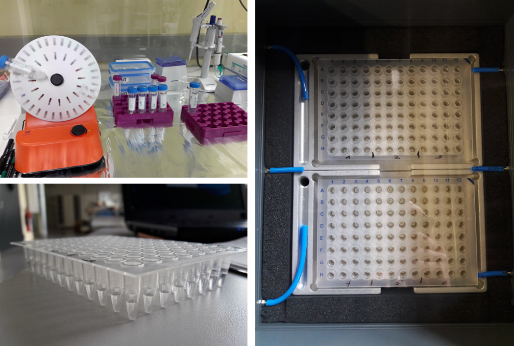
In the INSEKT, either bulk aerosol samples or aerosol samples from ambient air collected on filters or with an impinger can be analysed. In a flow cabinet, which creates a clean and particle free environment, the aerosol samples are prepared for the analysis with INSEKT by bringing the collected aerosol particles in suspension using filtered nanopure water.
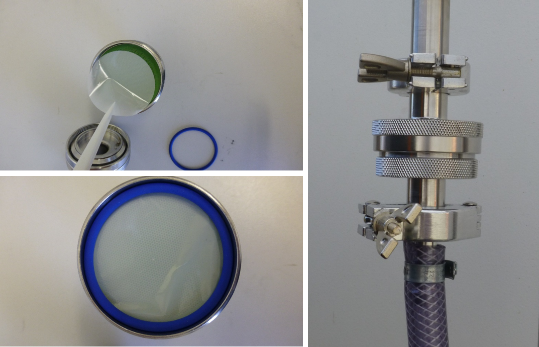
The main component of INSEKT is formed by two insulated aluminium blocks, each with openings for holding two 96 well PCR plates with each well filled with 50 μl of the aerosol suspension. The aluminium blocks are connected to a chiller in order to cool them with a constant cooling rate by pumping ethanol as a cooling liquid through the blocks. Eight temperature sensors that are evenly distributed inside the two aluminium blocks measure the temperature with a 2 Hz resolution. A camera is used to detect brightness changes of the aerosol suspension volumes inside the wells. If a sample volume freezes, its brightness decreases, so that it is possible to determine the frozen fraction of the samples by monitoring brightness changes. From the frozen fraction, the temperature-dependent INP concentration per litre of air or per mg of bulk sample can be calculated.
Advantages
- aerosol particles collected in the field as well as artificial particles from the laboratory can be investigated regarding their ice-nucleating activity
- covers a wide temperature range relevant for mixed-phase clouds from about 0°C to about -25°C
- favourable to measure INPs that are active at high temperatures like biological INPs
- almost no size limitations: investigation of large micrometer-sized INPs possible
- controlled cooling rates up to about 2 K/min
Examples for typical experiments with INSEKT
The left video shows the camera view during an experiment using pure water and an aerosol suspension in three different dilutions. The freezing of the single wells is detected by the change in the wells brightness. In the upper left the average temperature is shown. The wells with the undiluted suspension start to freeze first, follwed by the 15:1 and the 225:1 diluted suspension. Finally, the pure water freezes.
The right video shows the data during an experiment in 4 single graphs. The graph in the top left depicts the PCR plates (as shown in the left video), colour coded according to their greyscale. The graph in the top right marks the individual dilutions, where 0 corresponds to the filtered nanopure water, and the following numbers to the different dilutions of the aerosol suspension (no dilution, 15:1, 225:1 and 3.375:1). The graph in the bottom left shows the average temperature profile with a temperature gradient of 0.33 K/min and the graph in the bottom right shows the greyscale of four representative wells (as marked in the top right graph).
As soon as a well freezes due to the temperature reduction (bottom left), its grey scale decreases (top left and bottom right for the marked well). Therewith, the fraction of frozen wells increases, which goes along with an increase in INP concentration.

